The Advanced Dashboard in EZOfficeInventory enables you to track ongoing events, upcoming reservations, metric cards, and more – all from one place.
Learn how you can stay up to date with all the happenings of your business at a glance.
1. Need for the Advanced Dashboard
When dealing with a lot of different assets, employees and departments, it becomes critical to have certain key metrics always at hand. KPIs like asset utilization need to be continually tracked so teams are always up-to-date with equipment status.
The Advanced Dashboard does exactly this in a user-friendly layout. It allows you instant access to key asset metrics like reservations and checkouts, and empowers you to customize them as per your functions.
2. How to customize the Dashboard
You can easily customize the Dashboard and choose which KPIs you want to display, where you want to place them and for what time period you want to analyze the metrics.
We’ll explain how you can do all of this, and more, as we move along.
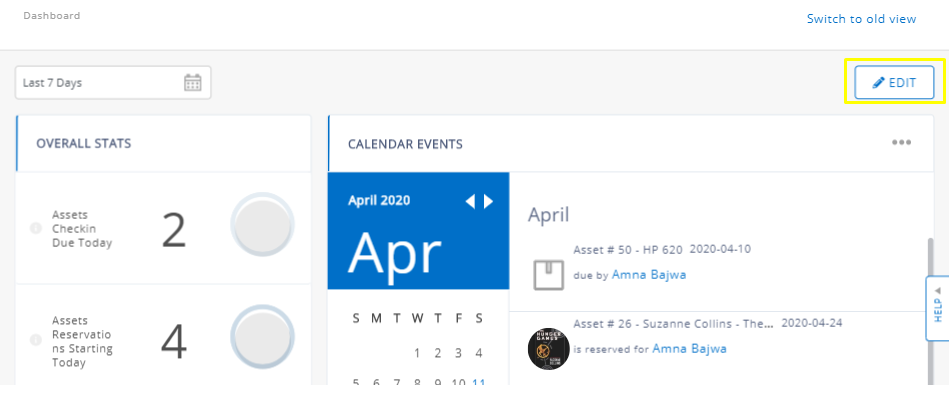
To choose the KPIs to display on your EZOfficeInventory Dashboard, click on the ‘Edit’ button in your Dashboard.
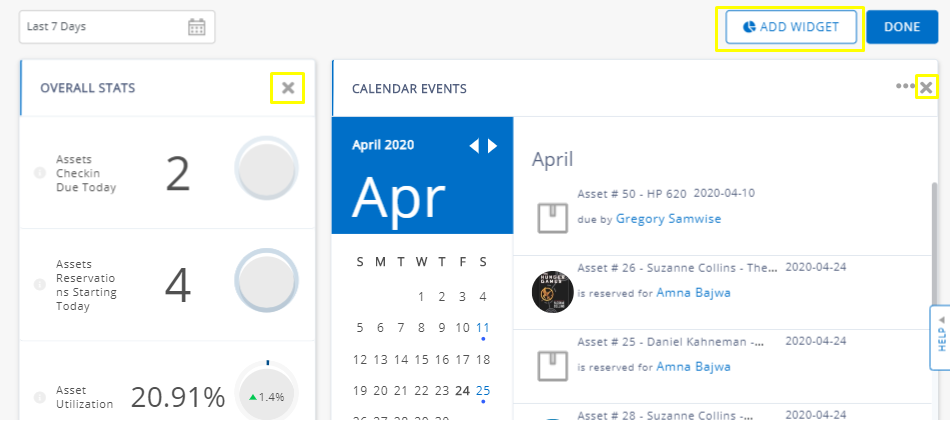
Once you click the ‘Edit’ button, all active widgets will become editable. You can use the ‘x’ at the top-right corner of a widget card to remove it. You can also drag and drop widgets to customize your view.
To add a new widget, click on ‘Add Widget’.
This will open a new dialog that displays a collection of available widgets. Select the ones you’d like to see on your Dashboard.
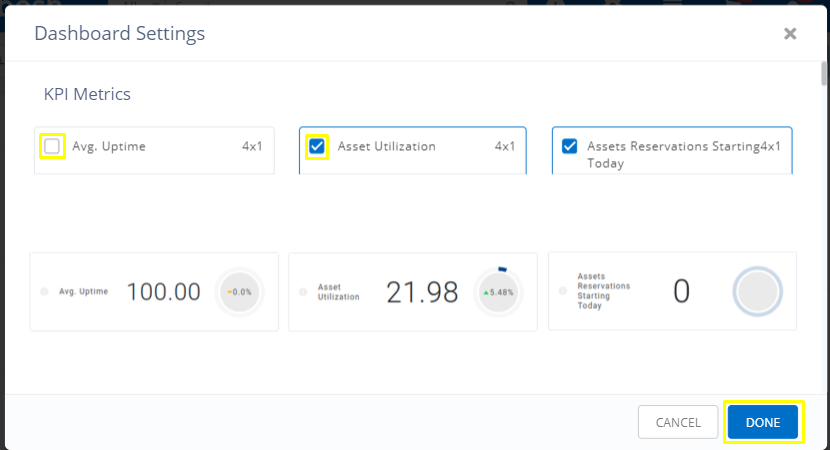
Next, click on ‘Done’ to close this dialog. After it closes, click on the ‘Done’ button on the main Dashboard. This ensures that your chosen settings are implemented.
You can Switch to the basic view from the top-right of the Advanced Dashboard page. This view provides you with a snapshot of all reservations, scheduled maintenance sessions and more in your Dashboard Calendar.
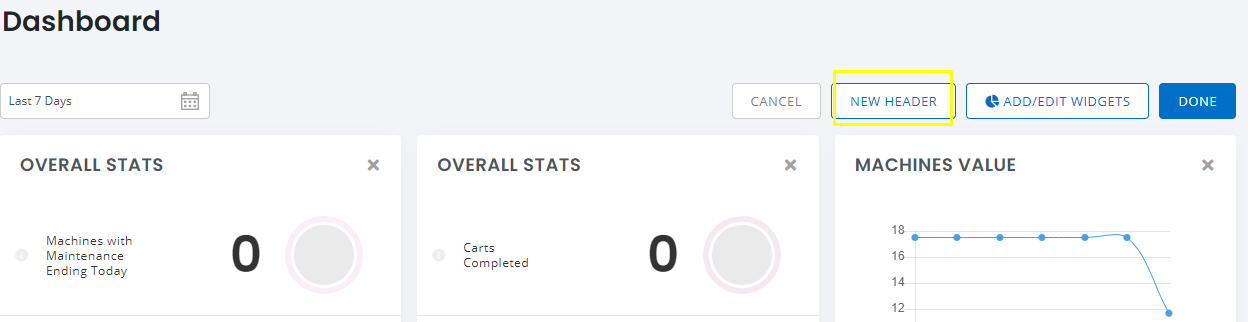
3. Add section header
Users can display asset information on the Dashboard in an organized manner. By using the new widget, “Header”, users can now organise their dashboard widgets in a way which delivers a better understanding of the what’s going on in their account.
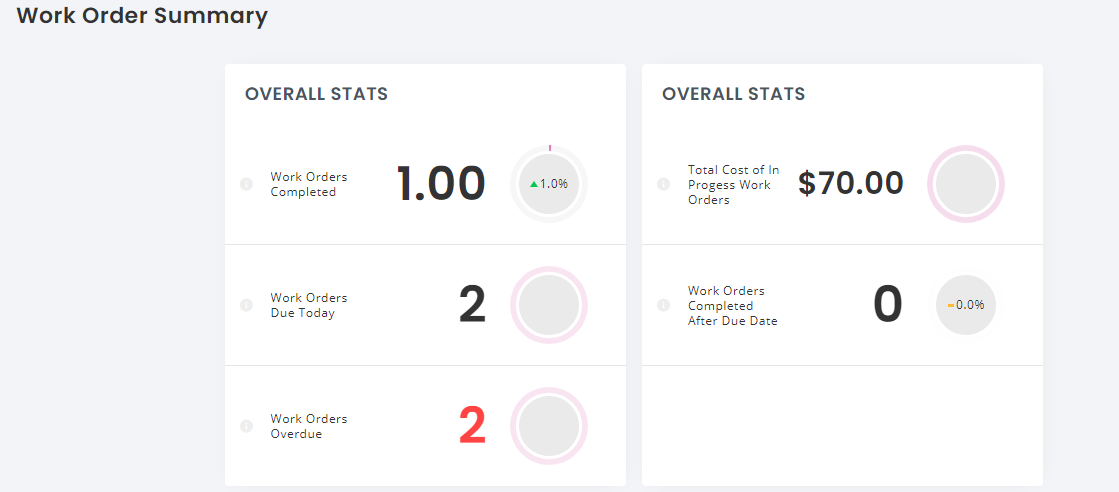
You can add as many headers you want to categorize your asset information. A Work Order Summary header looks like this:
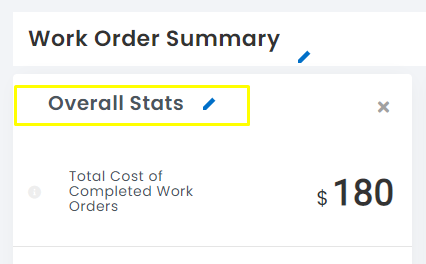
You can also edit the Overall Stats header to generate customized headings according to your business requirements.
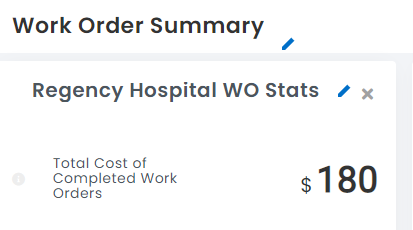
For instance Work Order Summary for a project for Regency hospital will look like this:
4. Get familiar with the Advanced Dashboard
Here’s a quick visual of a card to help you understand what the different symbols refer to:
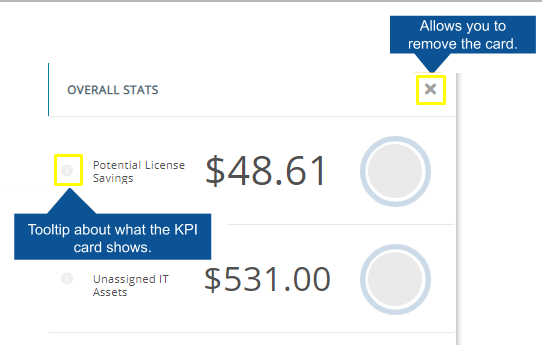
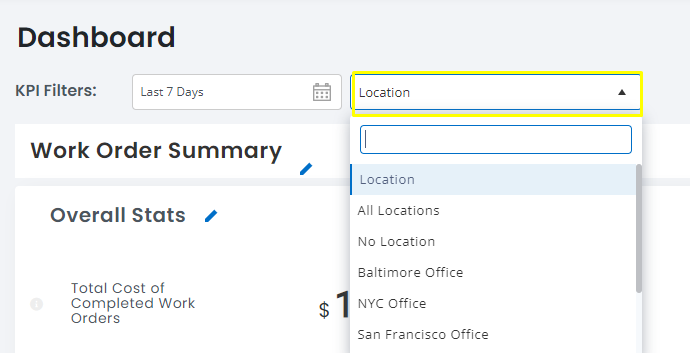
For easy reference, you can even filter out all KPIs on the Dashboard by Locations.
5. Flexible Dashboard Metric Cards
You can move around the Metric Cards on the Dashboard as you wish. This way, you can keep the most important KPIs at the top. You can do this when the Advanced Dashboard is in ‘Edit’ mode.
For example, if you’re a construction company, then you’re going to need to know how many Work Orders are still pending completion, so you can prioritize these as per your use cases.
Easily select and drag the Work Orders Overdue card to the top row, where it is easily visible.
6. View metrics for a particular time period
The time period for your metrics appears at the top-left of your Dashboard. This enables you to select the time period for which you want to display the metrics.
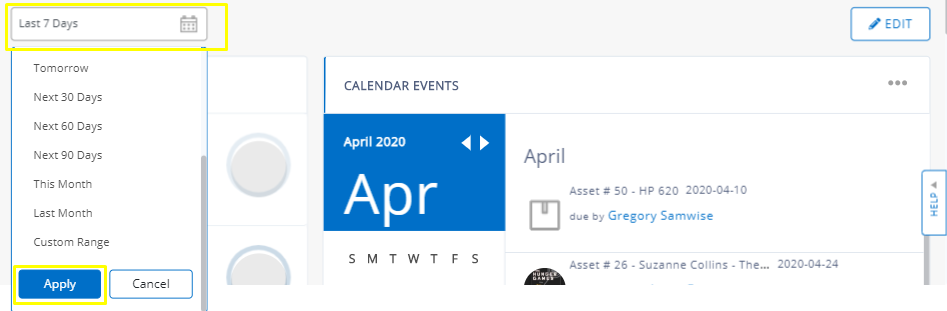
You can also set a custom range to view data between specific dates.
Once you define or select the time period you want, remember to hit the ‘Apply’ button to save the settings.
7. Quick lookup with Global Search
The Global Search Bar on the top left of the Dashboard lets you search within the EZOfficeInventory app for immediate access. The search bar is divided into two sections:
1. Dropdown menu that lets you select the Modules you want to search in
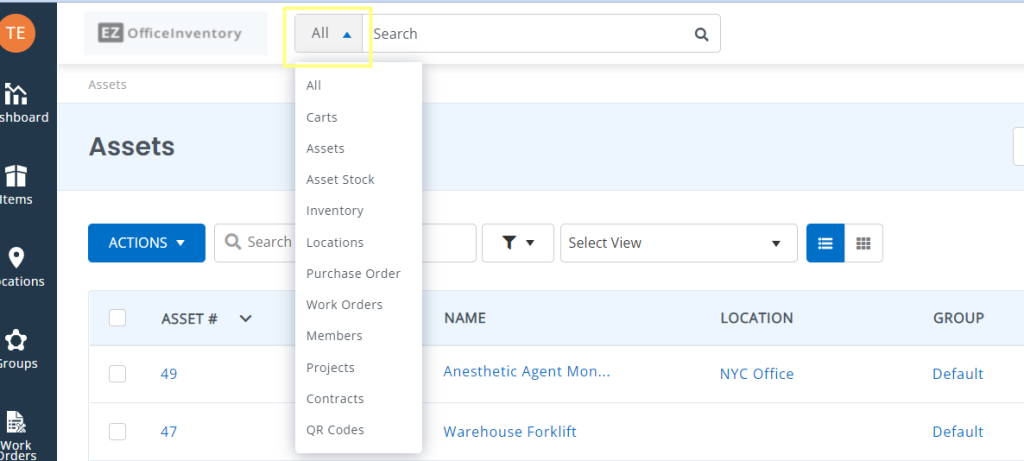
2. Search field to type in specific barcodes, Order numbers, or Asset names.
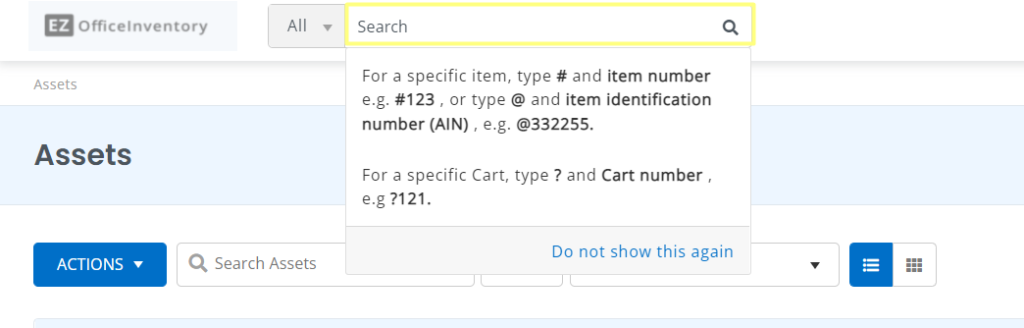
For example, you would like to search for Asset Stock HDMI cables. Select Asset Stock from the dropdown and Search the name HDMI cables. Hit the Search icon and you’ll be redirected to the Asset Stock details page.
7. Enable Add Ons for more KPIs
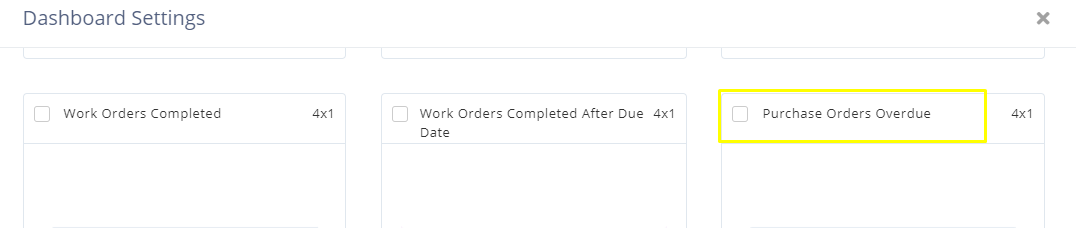
There are some KPIs that can only be selected to appear on the Dashboard if you enable the relevant Add Ons.
For example, the KPIs related to Purchase Orders will only appear if you’ve enabled Purchase Orders from Settings → Add Ons → Purchase Orders.
After you enable the Add On, you’ll be able to see metrics relevant to it in the Dashboard Settings.
Read More: Managing Purchase Orders with EZOfficeInventory
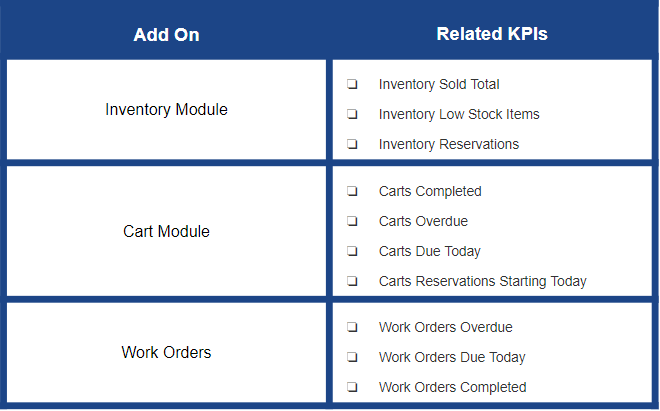
Similarly, there are numerous other Add Ons that you can enable to view their KPIs on your Dashboard. Here’s a table that lists down all of them:
Have any questions?
We love hearing from you! If you have any queries or confusions about EZOfficeInventory, reach out to us at support@ezo.io and our support team will get back to you.